
Navigating Analytics Reports
What are reports?
Reports let you slice and analyze your ad performance data in custom ways. Each report is a saved view with its own metrics, grouping, filters, date range, and chart type — so you can quickly revisit the insights that matter most.
Template reports
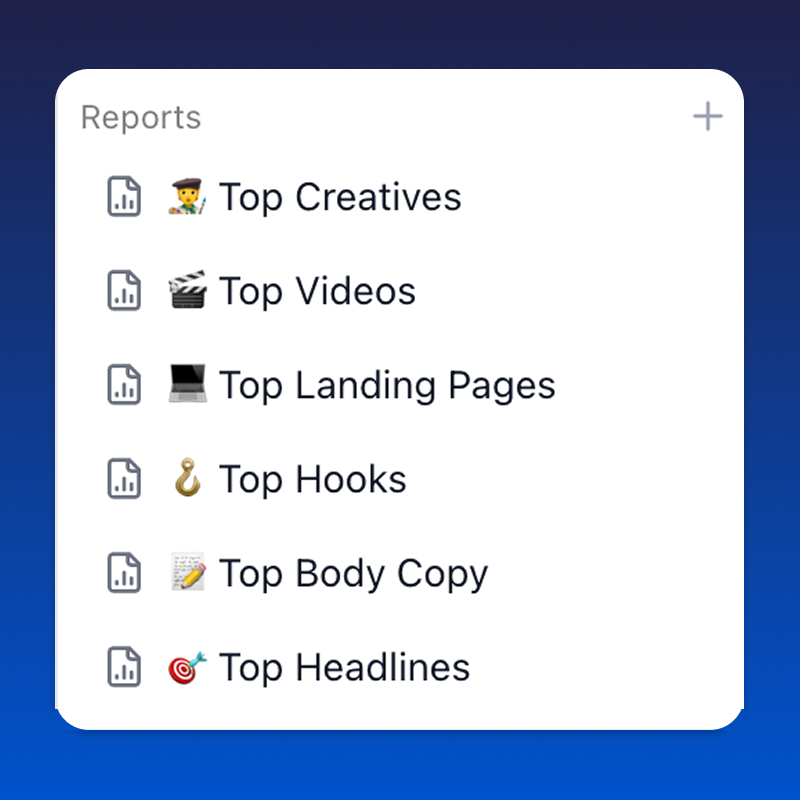
When you connect an ad account, Skaler automatically creates 8 template reports to get you started:
- Top Creatives — Best-performing creative assets by spend and ROAS.
- Top Videos — Highest-performing video ads.
- Top Images — Highest-performing image ads.
- Top Landing Pages — Landing pages with the best conversion rates and revenue.
- Top Hooks — Ads with the highest hook rates that capture viewer attention.
- Top Body Copy — Best-performing ad body copy by CTR.
- Top Headlines — Top headline variations by engagement.
- Video Retention — Video viewer retention across different time intervals (1s, 2s, 3s, 5s, 10s, etc.).
These reports are ready to use immediately — just open one to see your data.
Creating a new report
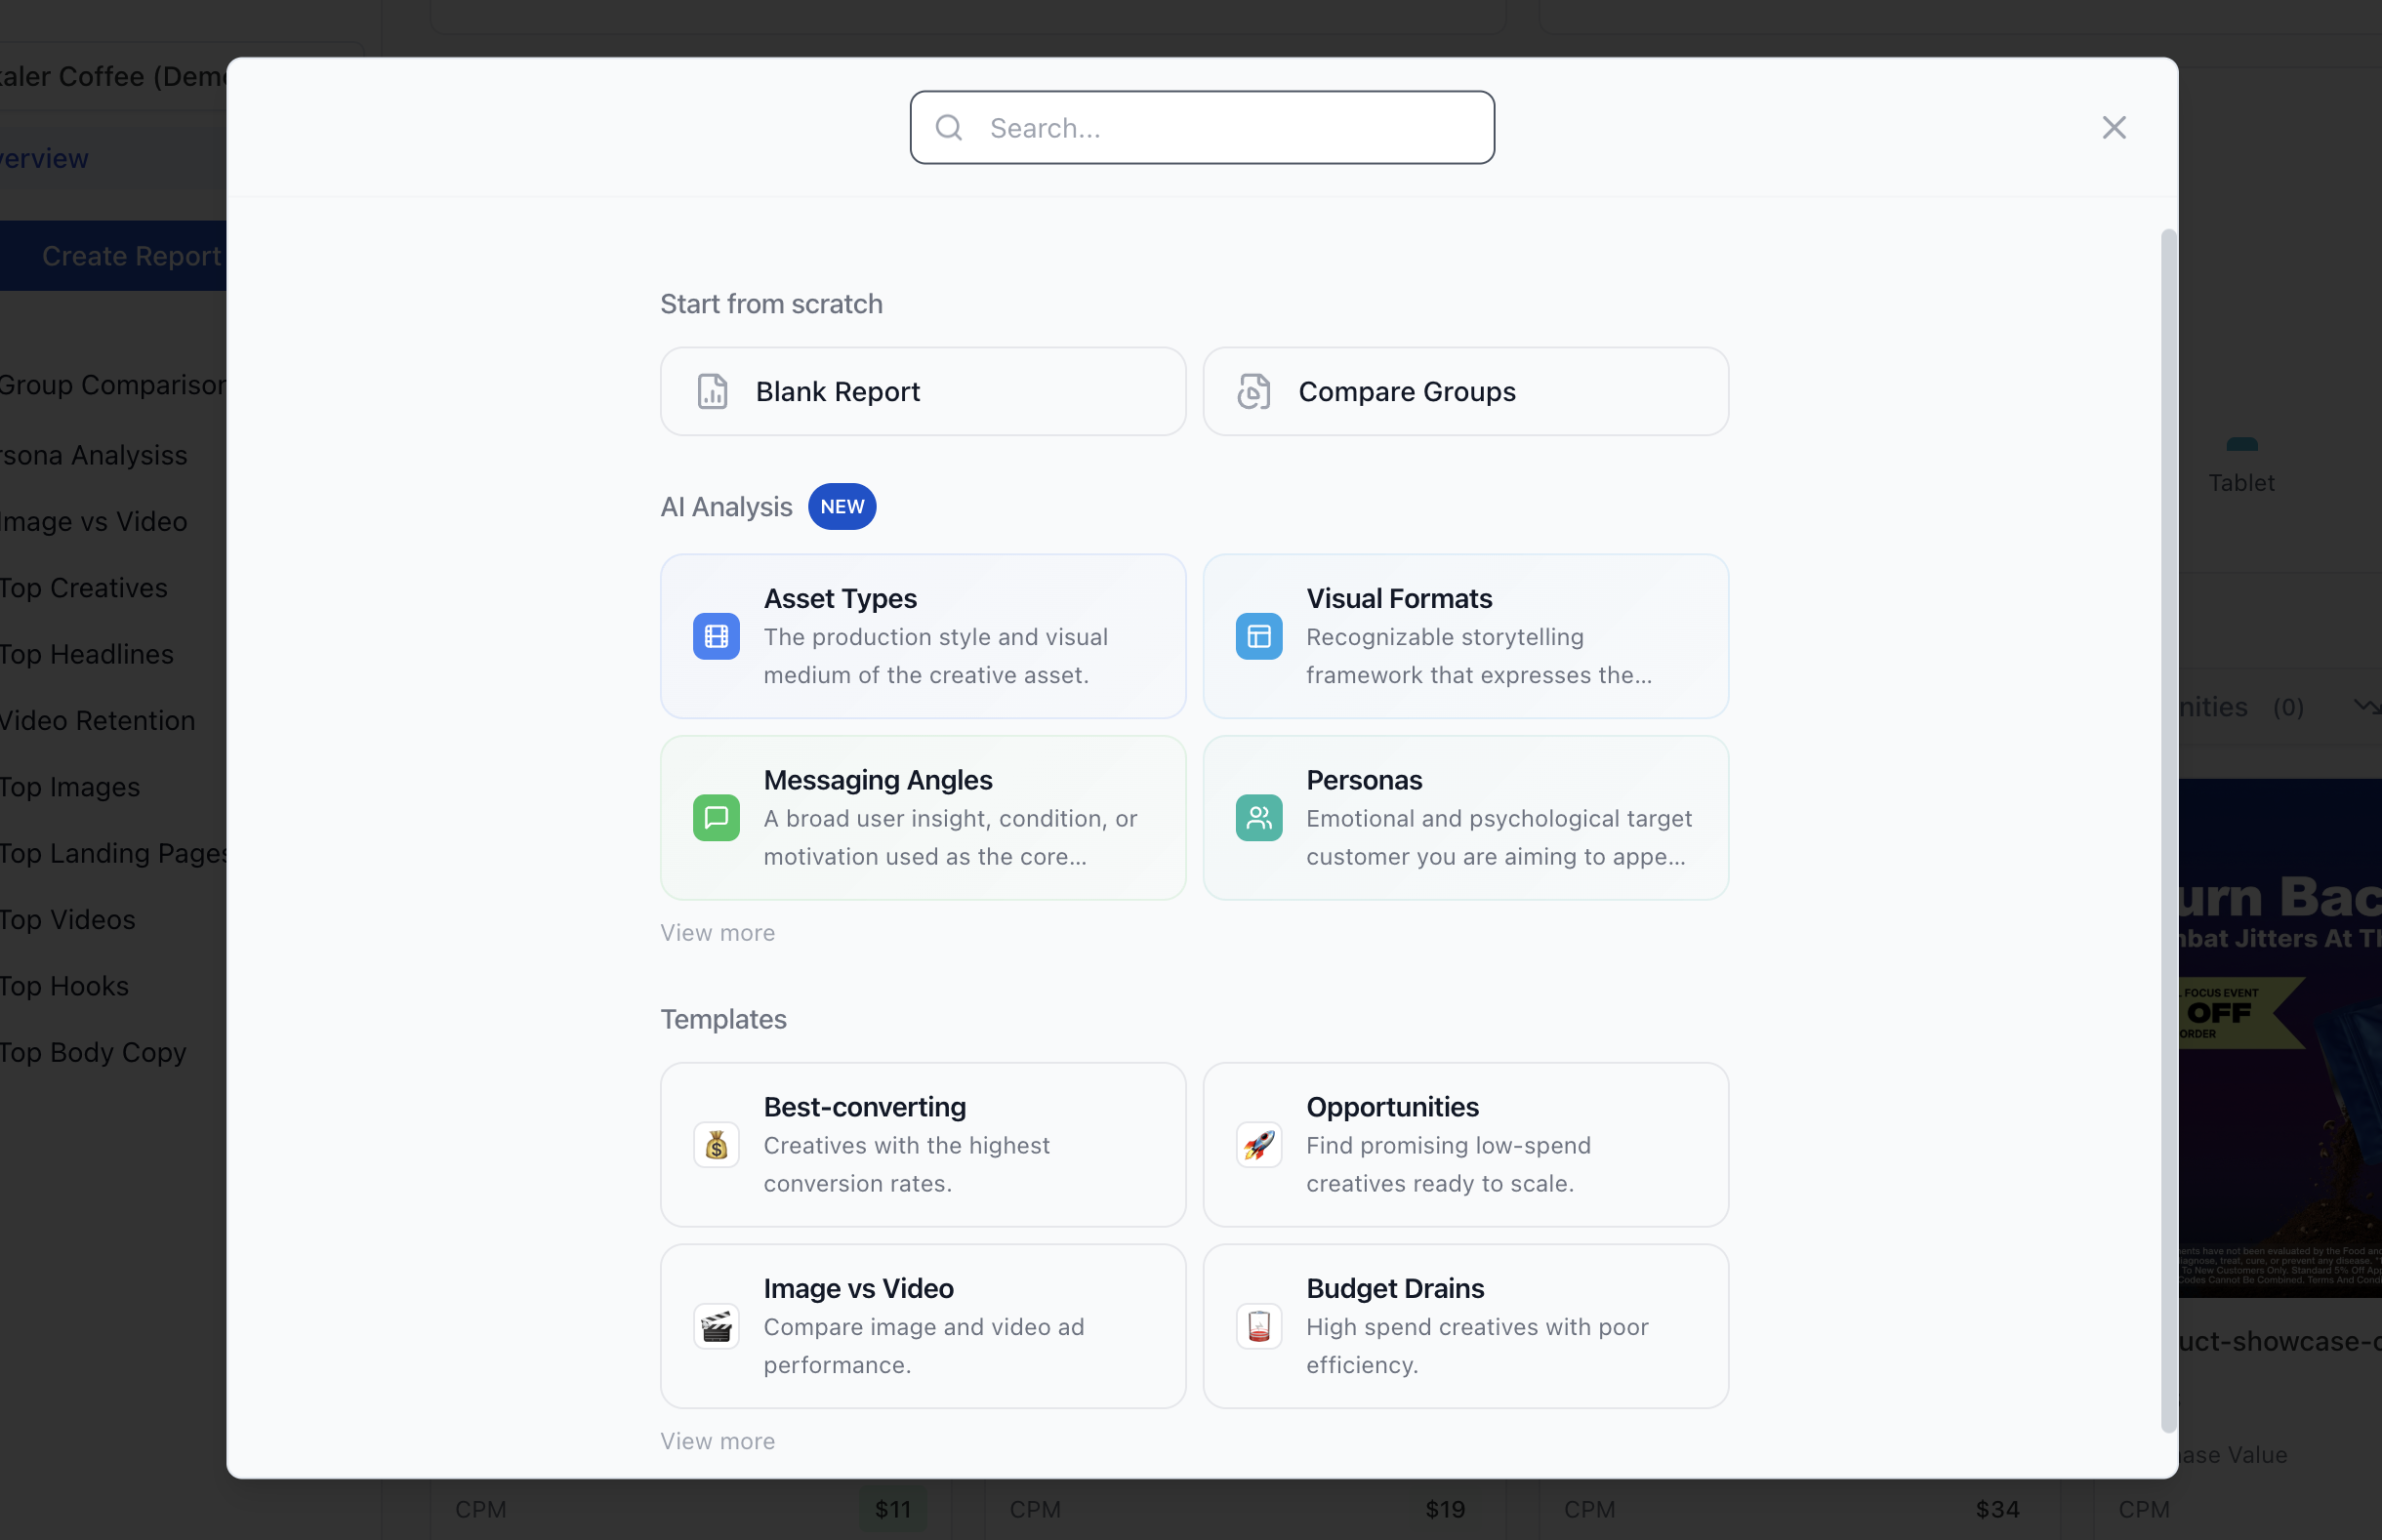
- Open the Analytics sidebar and click Create Report.
- Choose how to start:
- Blank Report — Start from scratch with a standard report.
- Compare Groups — Create a comparison report with multiple filter groups side by side.
- AI Analysis — Start from an AI tag category (see AI-Tagged Reports).
- Templates — Pick from pre-built templates like Best-converting, Opportunities, Budget Drains, Underperformers, Top Engagers, or Video Retention.
Report controls
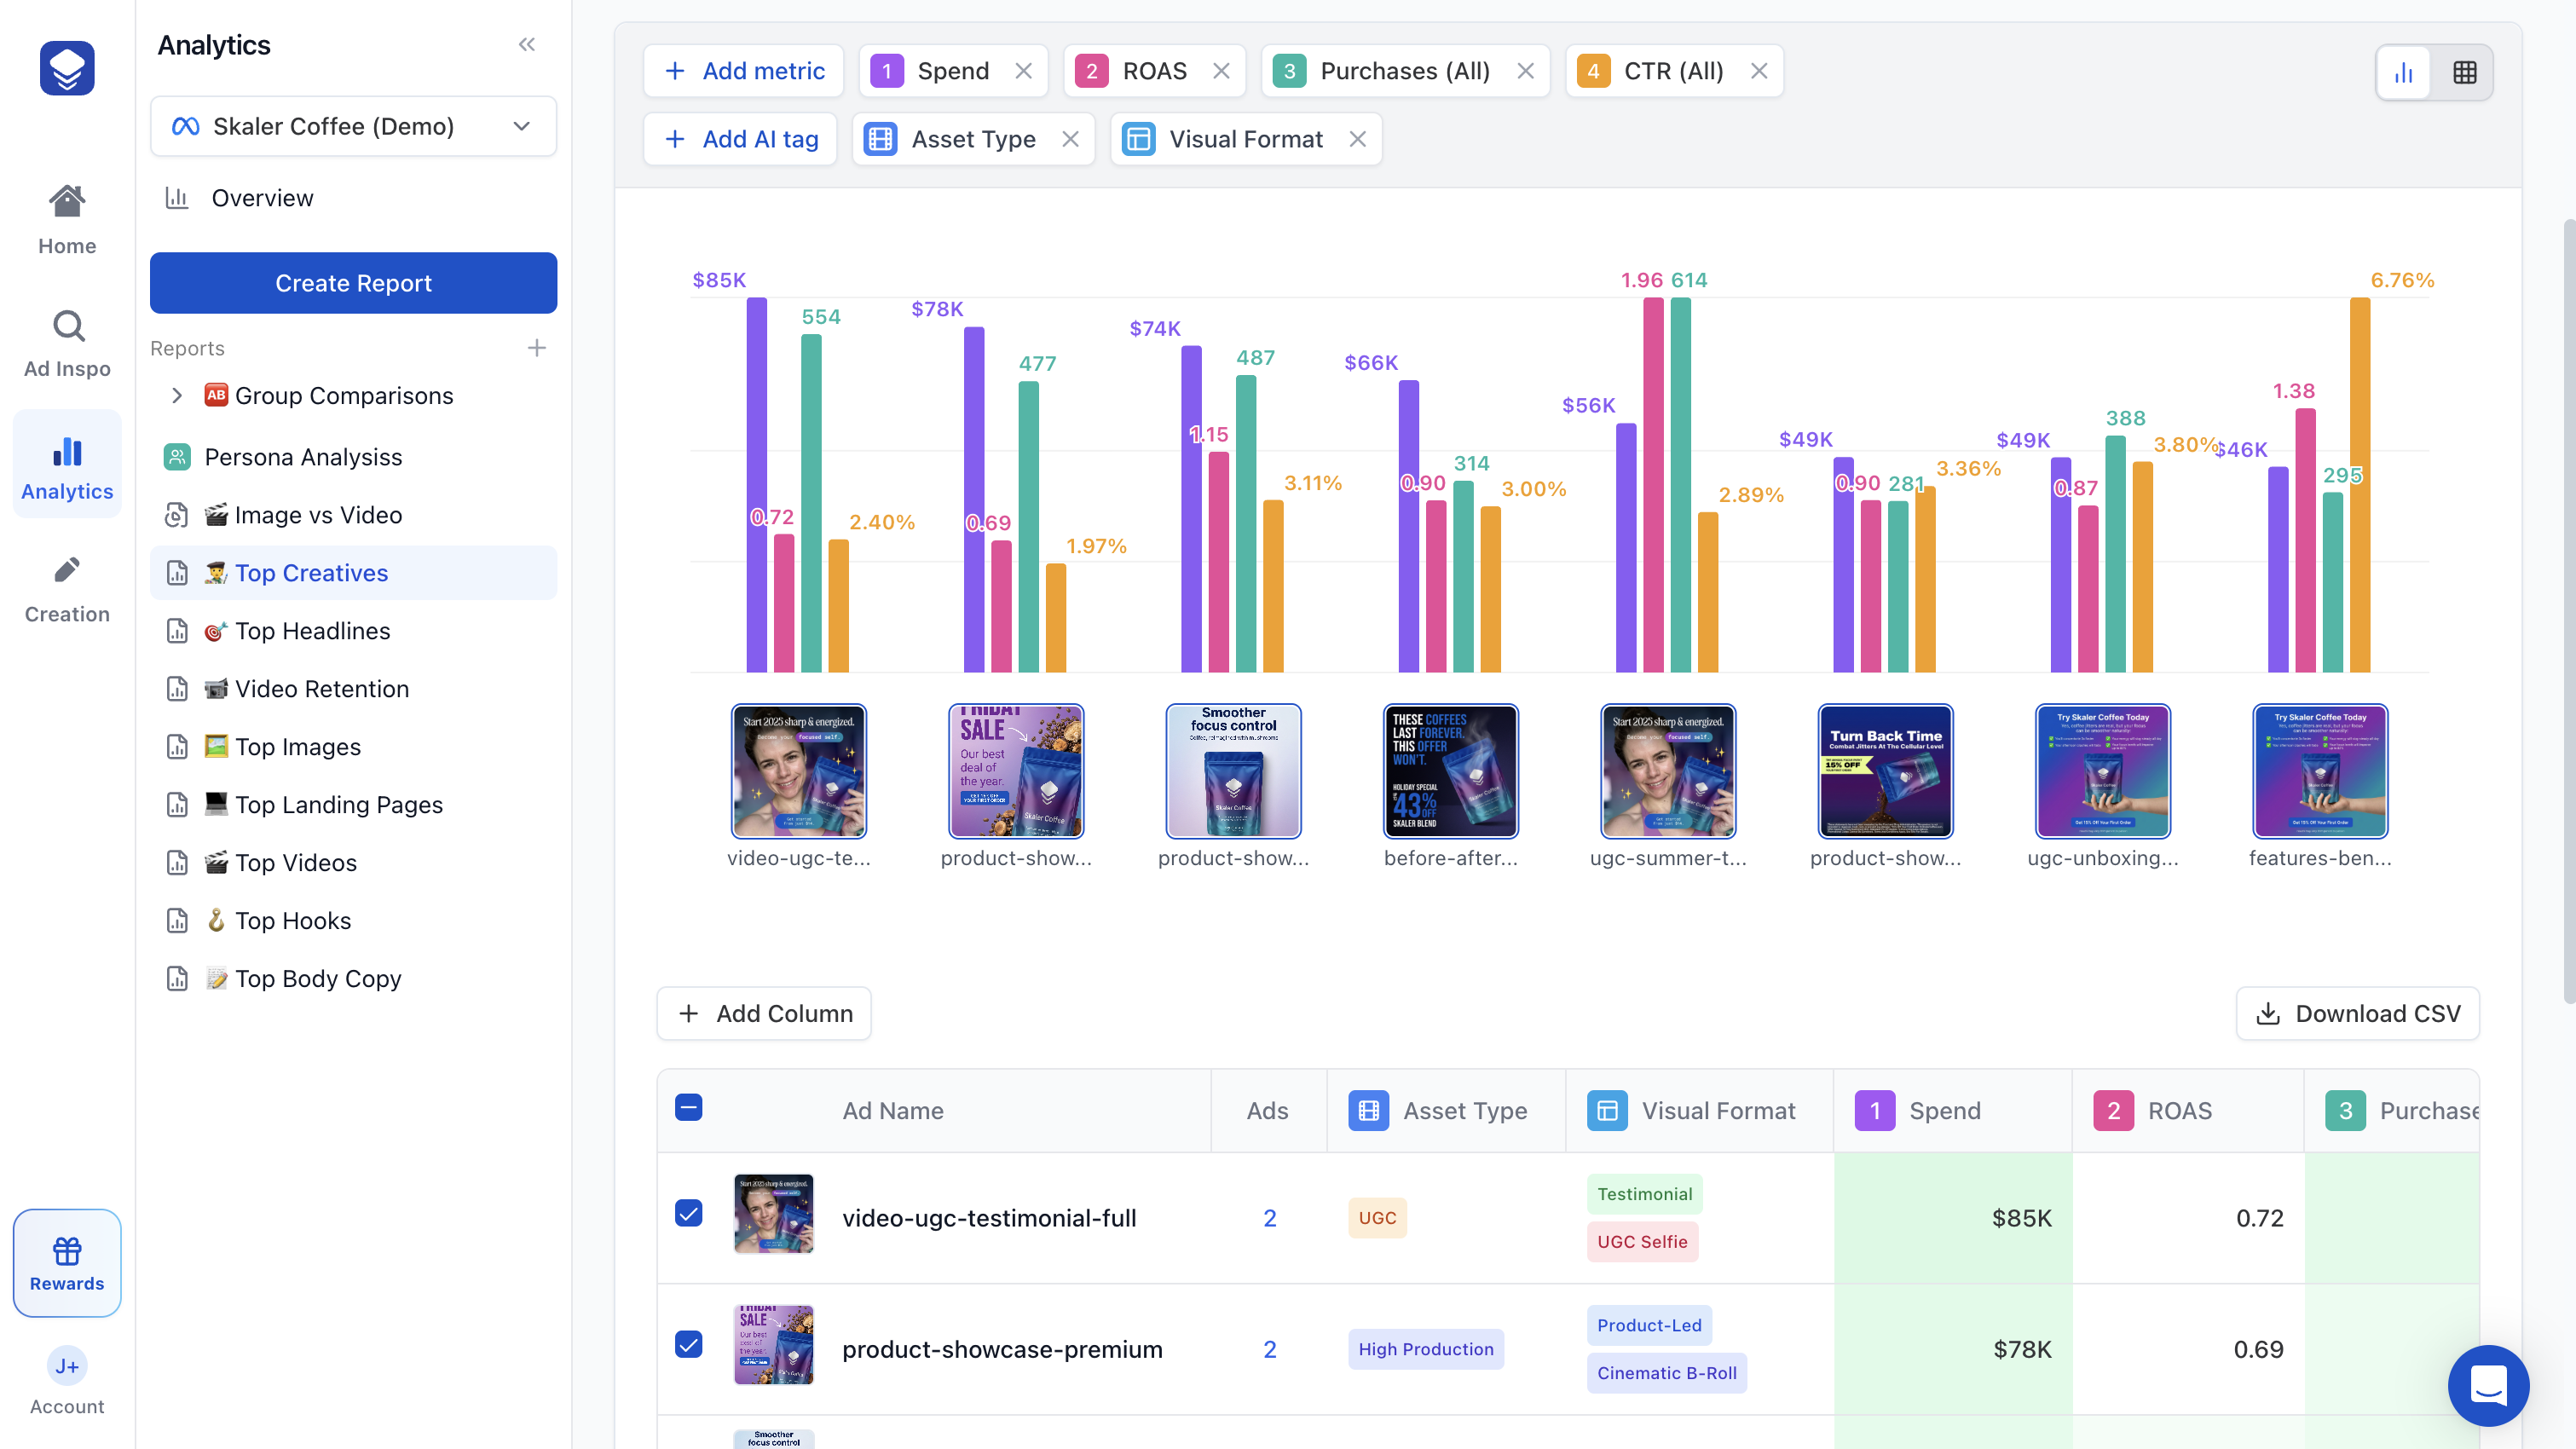
Each report has controls at the top to configure your view:
- Date range — Select a preset or custom date range.
- Group by — Choose how to group your data: by Ad Name, Creative, Headline, Body Copy, Landing Page, or AI tag categories.
- Filters — Add rules to narrow your data (e.g., spend > $100, type = video).
- Metrics — Choose which metrics to display in the chart and table.
Chart and table views
Reports show your data in two formats:
- Chart — Visual bar chart of your selected metrics. Toggle between chart types.
- Table — Detailed tabular view with all metrics, sortable by any column. You can add or remove columns and export to CSV.
Organizing reports
Keep your reports tidy with groups (folders):
- Click the + button next to "Reports" in the sidebar and select Create Group.
- Drag and drop reports between groups or reorder them.
- Rename or delete groups from their context menu.
Unfiled reports appear below your groups in the sidebar.
Sharing reports
To share a report with a colleague or client:
- Save the report first.
- Click the Share button to generate a share link.
- Copy the link — anyone with it can view the report (read-only).
You can remove the share link at any time from the report's menu.