
How to Analyze Ad Performance: A Data-Driven Approach
Stop guessing what works. Learn how to use creative analytics to identify winning ads, spot fatigue early, and scale your best performers with confidence.

 Follow on LinkedIn
Most marketers drown in data but starve for insights. Your ads manager shows you thousands of metrics, but which ones actually matter? And more importantly, what should you do about them?
This guide will teach you how to analyze ad performance like a pro, identify your winners, and make data-driven decisions that scale your results.
The Metrics That Matter
Not all metrics are created equal. Here's how to prioritize what you track.
Primary Metrics (Your North Star)
These metrics directly tie to business outcomes:
1. ROAS (Return on Ad Spend)
Your most important metric. If you spend $100 and make $500, your ROAS is 5x.
- What's good? Depends on your margins, but generally 3x+ is solid for e-commerce
- When to worry: ROAS declining over time usually means creative fatigue
- Pro tip: Segment ROAS by creative to find your true winners
2. CPA (Cost Per Acquisition)
How much you pay to acquire one customer.
- What's good? Should be significantly lower than your customer lifetime value (LTV)
- When to worry: CPA creeping up often signals market saturation or ad fatigue
- Pro tip: Track CPA by creative type (UGC vs. product shots vs. testimonials)
3. Conversion Rate
The percentage of people who take your desired action.
- What's good? 2-5% is typical for cold traffic e-commerce
- When to worry: High CTR but low conversion rate = poor message-market fit
- Pro tip: Low conversion despite strong ad creative? Your landing page needs work
Secondary Metrics (Leading Indicators)
These predict future performance:
CTR (Click-Through Rate)
The percentage of people who see your ad and click it.
- What's good? 1-3% is solid for cold audiences
- What it tells you: Are you grabbing attention? Is your hook working?
- Warning: High CTR but low ROAS means you're attracting the wrong audience
CPM (Cost Per Thousand Impressions)
How much you pay to show your ad to 1,000 people.
- What's good? Varies wildly by industry and targeting
- What it tells you: How competitive is your auction? Is your creative fatiguing?
- Pro tip: Rising CPM = Meta is showing your ad to less interested users (fatigue signal)
Hook Rate (First 3 Seconds)
For video ads, what percentage watch at least 3 seconds?
- What's good? 30%+ is strong. 50% is fenomenal.
- What it tells you: Is your hook breaking the scroll?
The Creative Analysis Framework
Here's a step-by-step system to analyze your ad creative performance:
 Visual: Step-by-step analysis workflow
Step 1: Segment Your Creatives
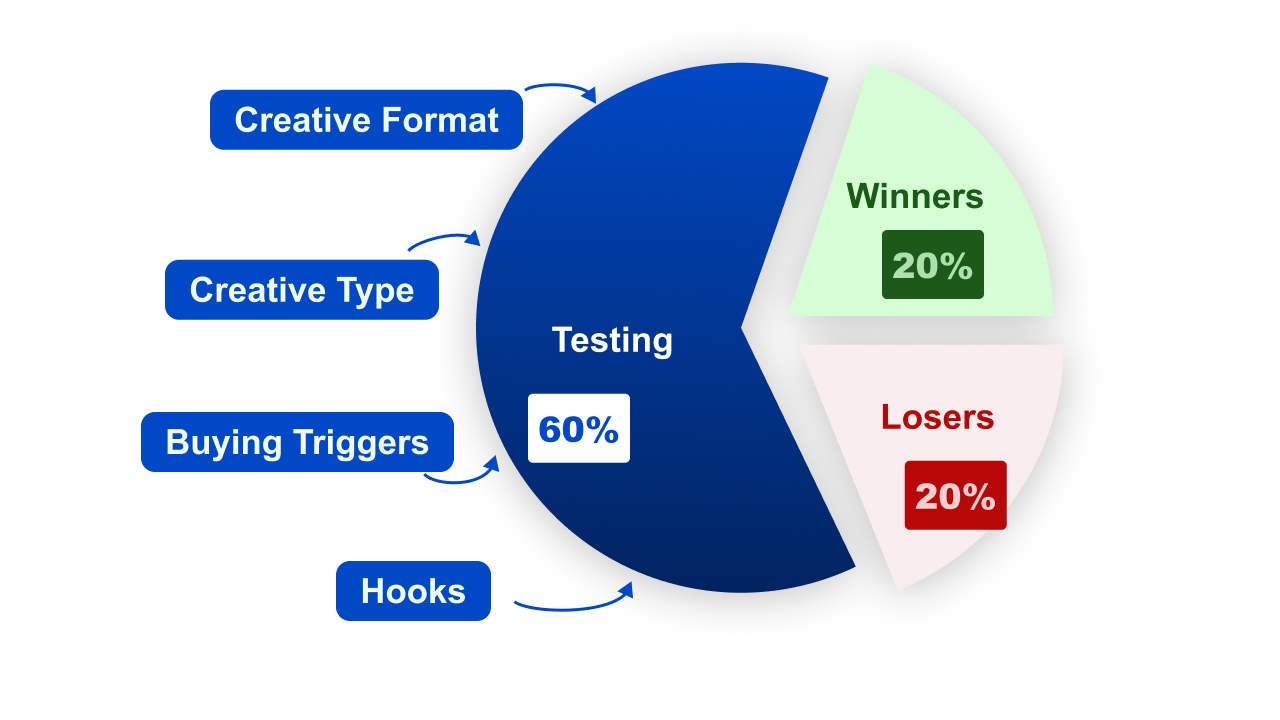
Don't just look at campaign-level metrics. Segment by:
- Creative format (video, image, carousel)
- Creative type (UGC, product shot, testimonial)
- Hook type (problem-focused, benefit-focused, visual candy)
- Buying triggers (scarcity, urgency, transformation, social proof)
In Skaler's Creative Analytics, this segmentation is grouped automatically. For Meta Ads Manager, you'll need to analyze your creatives one by one.
Step 2: Identify Your Winners
Apply the 80/20 rule:
- Top 20%: Your winners. Scale these and create variations
- Middle 60%: Still testing. Give them more data
- Bottom 20%: Losers. Pause them and learn why they failed
Example Analysis
You're running 10 ad creatives. After $50 spend each:
| Creative | ROAS | CPA | CTR | Type |
|---|---|---|---|---|
| Creative A | 4.2x | $18 | 2.1% | UGC Video |
| Creative B | 3.8x | $22 | 1.9% | Product Shot |
| Creative C | 3.5x | $24 | 1.8% | Testimonial |
| Creative D | 2.1x | $38 | 1.2% | Lifestyle Image |
| Creative E | 1.8x | $45 | 1.0% | Feature List |
Action: Scale A, B, and C. Create variations of A (your clear winner). Pause D and E.
Step 3: Diagnose Performance Issues
When a creative underperforms, ask why:
High CPM, Low Reach
- Diagnosis: Poor relevance score or wrong audience
- Fix: Broaden targeting or try a different creative angle
High CTR, Low Conversion Rate
- Diagnosis: Misleading ad or landing page mismatch
- Fix: Align ad promise with landing page delivery
Low CTR
- Diagnosis: Weak hook or wrong audience
- Fix: Test new hooks or creative formats
High CPA Despite Good CTR
- Diagnosis: Attracting browsers, not buyers
- Fix: Add qualification language ("for serious marketers") or test different audiences
Spotting Ad Fatigue Early
Ad fatigue is inevitable. The key is catching it before it tanks your account.
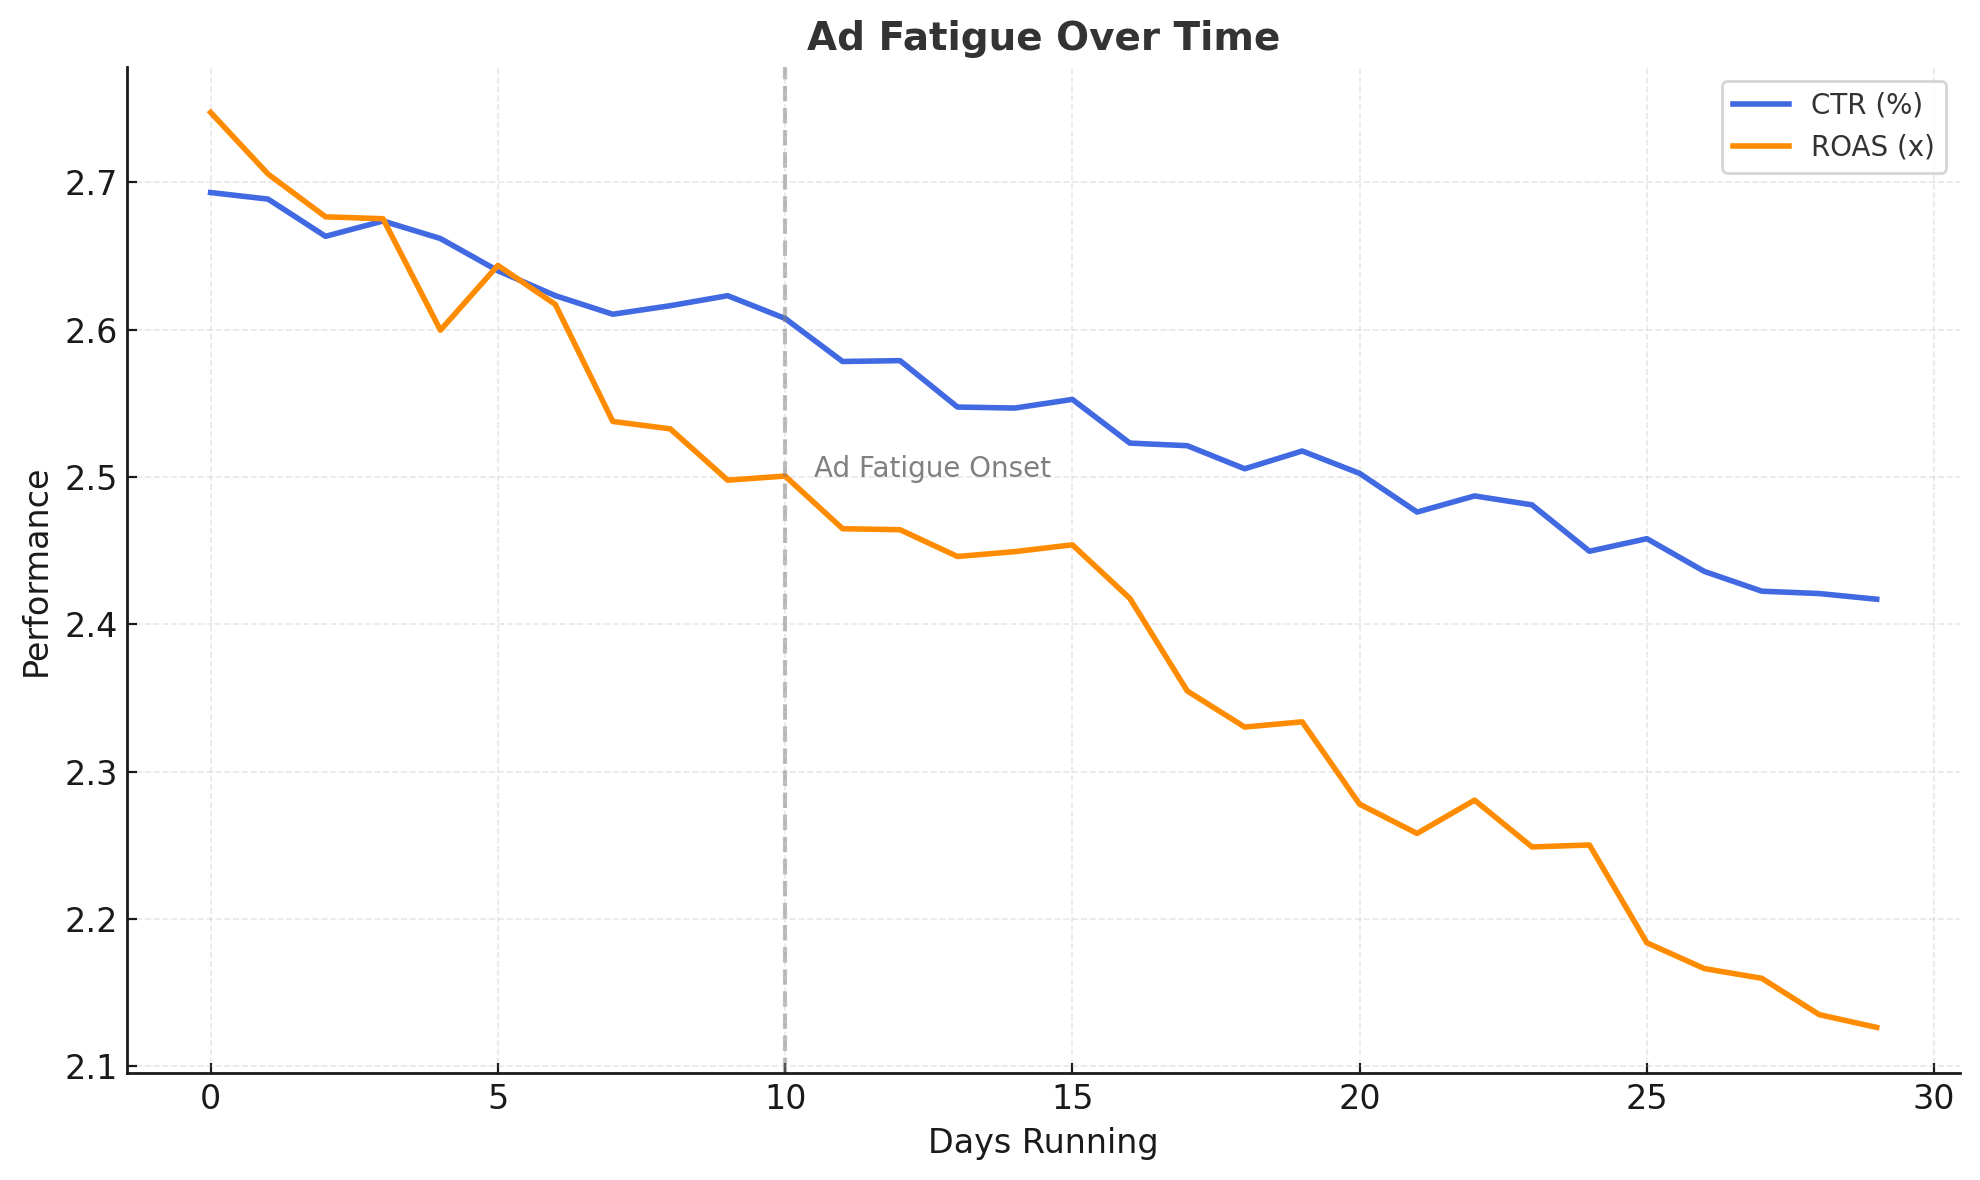 Chart: Performance decline patterns indicating ad fatigue
Warning Signs
- Declining CTR: Your hook isn't novel anymore
- Rising CPM: Meta is showing your ad to less interested users
- Decreasing ROAS: Same spend, less revenue
- Stagnant delivery: Meta stops scaling your winner
The Fatigue Timeline
Typical fatigue patterns by audience size:
- Small audiences (<10K): 3-7 days
- Medium audiences (10K-100K): 1-2 weeks
- Large audiences (100K+): 2-4 weeks
- Broad targeting: 4-8 weeks
Preventing Fatigue
Don't wait for fatigue to hit. Implement a creative rotation strategy:
Week 1-2: Launch new creative, monitor closely Week 2-3: If it's a winner, create 3-5 variations Week 3-4: Introduce variations while original is still performing Week 4+: Rotate in fresh concepts to replace fatigued creatives
With Skaler, you can generate variations instantly when you spot early fatigue signals.
Advanced Analysis Techniques
Once you've mastered the basics, level up with these techniques:
Cohort Analysis
Track performance by when ads launched:
- Are newer creatives performing better than older ones?
- Is your creative quality improving over time?
- Which testing periods produced the most winners?
Creative Element Testing
Instead of analyzing whole ads, analyze elements:
- Which hooks drive highest CTR?
- Which product shots generate best ROAS?
- Which CTAs drive most conversions?
Build a "winners library" of proven elements to remix into new ads.
If you regularly run surveys or collect customer feedback, tools like BTInsights can analyze open-ended responses at scale to uncover the themes, motivations, and language your audience actually uses—goldmine material for hooks and copy.
Competitive Benchmarking
Use Skaler's Brand Spy to track competitor creative strategies:
- Which of their ads run longest? (Probably profitable)
- What formats are they testing?
- How often do they refresh creative?
If a competitor is running the same ad for 90+ days, it's likely a winner worth studying (and cloning).
Attribution Window Analysis
Understand how quickly your ads convert:
- 1-day window: Mostly impulse purchases, lower intent traffic
- 7-day window: Standard benchmark
- 28-day window: High-consideration products
If your 7-day ROAS is 3x but 28-day is 5x, you need longer attribution tracking.
The Weekly Analysis Routine
Make data analysis a habit. Here's a sustainable weekly routine:
| Day | Time | Duration | Key Tasks |
|---|---|---|---|
| Monday | Morning | 30 min | Review weekend performance • Identify fatigued creatives • Pause obvious losers • Scale winners (increase budget or duplicate to new ad sets) |
| Wednesday | Mid-week | 15 min | Quick scan for major issues • Ensure new tests are delivering • Check if winners are hitting fatigue |
| Friday | End of week | 45 min | Deep dive into week's data • Identify creative patterns (what won/lost?) • Plan next week's tests • Generate variations of winners using Skaler • Set up new tests to launch Monday |
Turning Insights Into Action
Analysis means nothing without action. Here's what to do with your findings:
When You Find a Winner
- Scale it immediately: Increase budget or duplicate
- Create variations: Generate 3-5 versions with different elements
- Test new formats: Turn a winning image into video (or vice versa)
- Expand to new audiences: Test on lookalikes or different cold audiences
- Localize it: Translate for new markets
When Everything Is Losing
First, don't panic. Then:
- Check your fundamentals: Is your offer still compelling? Landing page working?
- Look at successful competitors: What are they doing that you're not?
- Test radically different concepts: Not just new designs, new angles entirely
- Consider market conditions: Holiday season? Industry changes?
When You Hit a Plateau
You've scaled your winners but can't grow further:
- Increase creative volume: You need more winners
- Test new creative formats: If static ads worked, try video
- Explore new angles: Benefits, features, social proof, founder story
- Expand targeting: Broaden your audience definition
Tools for Better Analysis
The right tools make analysis 10x easier:
Essential Tools
Creative Analytics Platform: Skaler's Creative Analytics gives you creative-level performance tracking, fatigue detection, and winning pattern identification—things standard Ads Manager makes tedious.
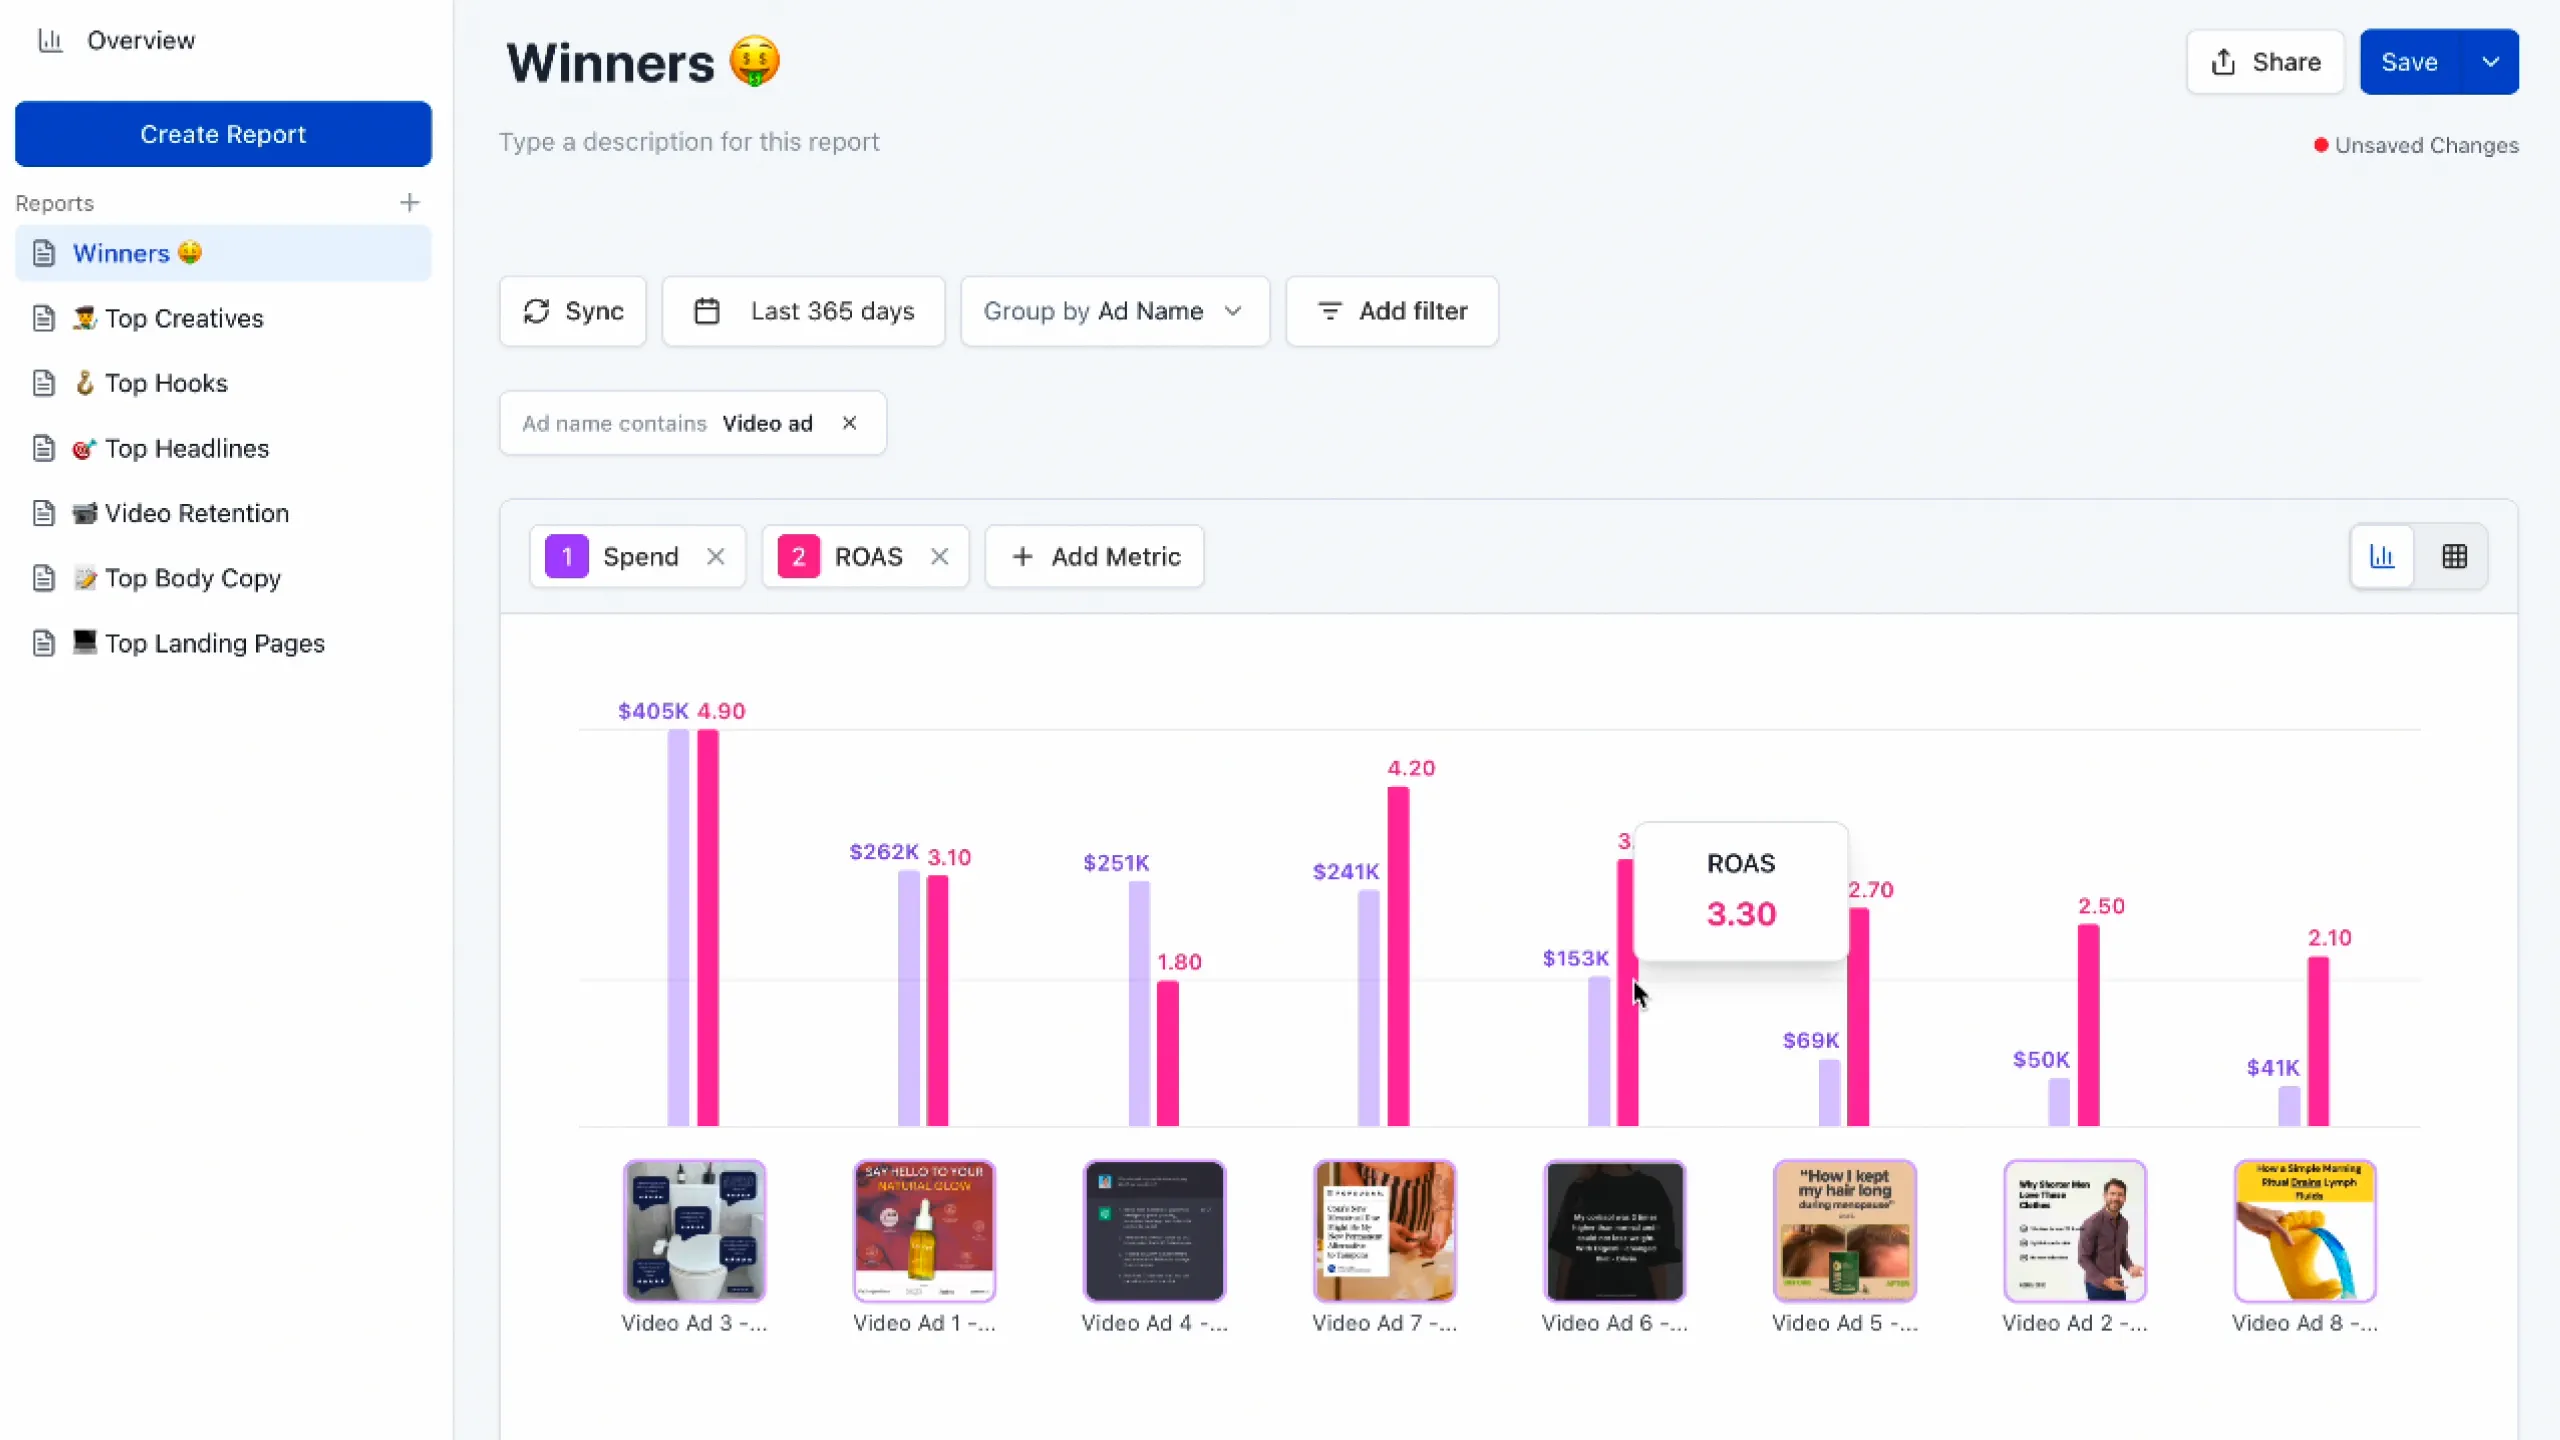 Visual: Skaler Creative Analytics dashboard
Spreadsheet for Tracking: Keep a creative library with performance data, elements tested, and learnings.
Screenshot Tool: Build a swipe file of your winners (and competitors') for inspiration.
Skaler's Analysis Advantage
Standard Ads Manager makes creative analysis painful:
- Difficult to find patterns
- Not used by ad creative teams
- No creative fatigue detection
- No pattern identification across creatives
- Slow load times and clunky interface
Skaler solves this with:
- Automatic creative grouping
- Identify fatigue before performance drops
- Pattern identification (which hooks, formats, types win)
- Instant loading and clean interface
- One-click creative refresh (generate new variations)
Your Action Plan
Ready to level up your analysis? Here's your roadmap:
This Week:
- Segment your current creatives by type, format, and hook
- Identify your top 20%, middle 60%, and bottom 20%
- Pause the bottom 20%
- Create 3 variations of your #1 winner
This Month:
- Implement the weekly analysis routine
- Build a "winners library" of your best performing elements
- Set up fatigue alerts (or use Skaler's automatic detection)
This Quarter:
- Analyze creative patterns: What types consistently win for you?
- Double down on those patterns
- Share learnings with your creative team or designer
Final Thoughts
Great creative analysis isn't about tracking every metric—it's about identifying patterns that drive real business results.
The marketers who win aren't necessarily more creative or have bigger budgets. They're just better at analyzing what works and doing more of it.
Start simple. Track the metrics that matter. Find your winners. Make more like them. Rinse and repeat.
And if you want to make this process 10x easier, try Skaler's Creative Analytics—it's built specifically for this workflow.
Now go analyze some ads and find your next winner.
Related Resources
- Static Ads in 2025: 25+ Examples & When to Use Them — Patterns, templates, and testing framework
- Facebook Ads Not Converting? 15 Fixes for 2025 — Step-by-step troubleshooting guide
- Meta Ads Library: Complete 2025 Guide — How to research competitor ads for free
- 5 Ad Creative Best Practices — Strategies that actually drive conversions
- Best AI Ad Generators in 2025 — Compare tools for creating ads with AI
Related Articles
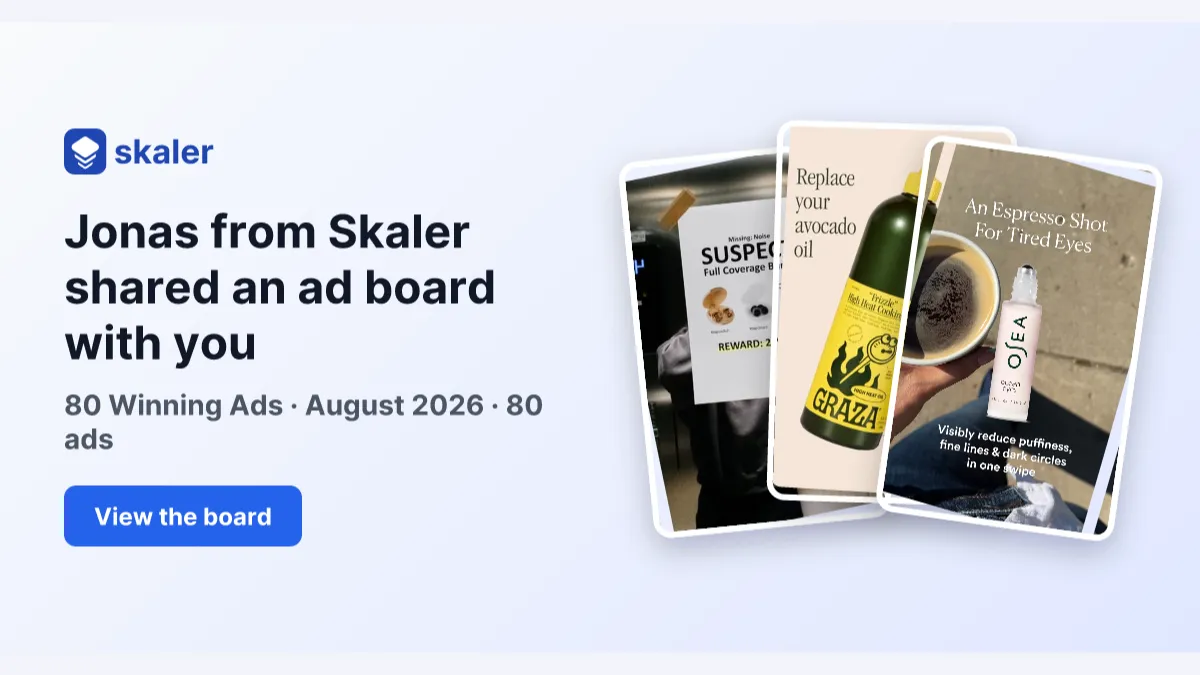
The 80 Most-Saved Meta Ads of August 2026 (Free Swipe File)
We tracked the 80 Meta ads media buyers saved the most this month — from Seed and Loop to AI soap operas running across 9 ad sets. Browse all 80 free, plus the 4 patterns behind them.
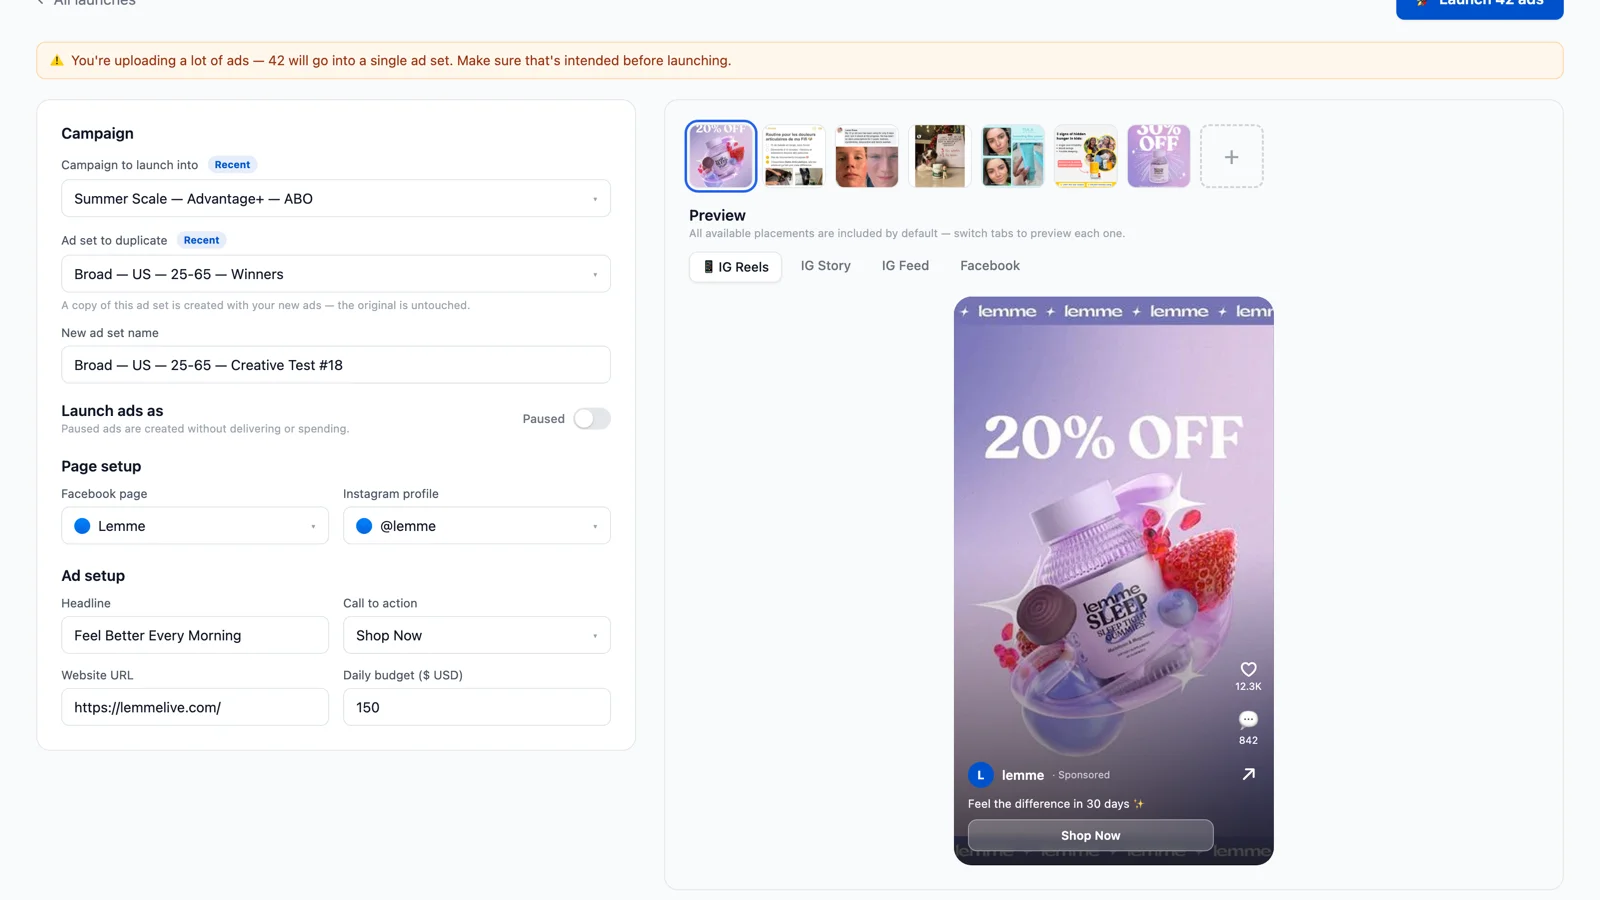
Bulk Ad Launcher for Meta: Launch 100 Facebook Ads in One Click
Skaler's new Bulk Ad Launcher takes you from creatives to live Facebook ads in minutes — drag and drop up to 100 files, duplicate a winning ad set, and launch with copy, budgets, and tracking auto-filled.